|
Weekly |
| |
Day |
Hits |
% |
Bytes |
% |
Sessions |
Visitors |
Pages |
Errors |
|
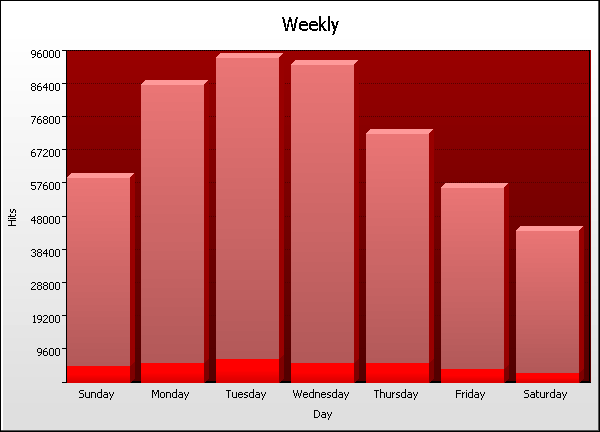
1 |
Sunday |
|
|
6,214 |
2,624 |
15,138 |
5,550 |
|
2 |
Monday |
|
|
7,179 |
3,230 |
18,397 |
6,365 |
|
3 |
Tuesday |
|
|
7,411 |
3,356 |
17,329 |
7,009 |
|
4 |
Wednesday |
|
|
5,707 |
2,539 |
12,873 |
5,804 |
|
5 |
Thursday |
|
|
5,942 |
2,441 |
10,943 |
6,182 |
|
6 |
Friday |
|
|
5,527 |
2,221 |
14,339 |
4,466 |
|
7 |
Saturday |
|
|
5,029 |
1,923 |
10,926 |
3,136 |
| |
Average |
|
|
6,144 |
2,619 |
14,277 |
5,501 |
|
7 |
Totals |
|
|
42,913 |
8,495 |
99,945 |
38,512 |
|
|