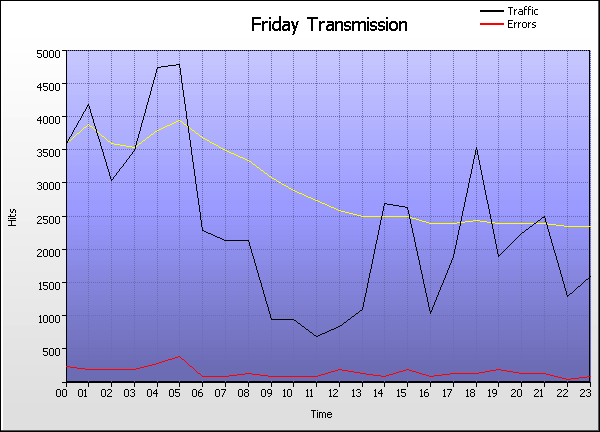
Time Graph
Go the Help Card.


Friday Transmission
  Time Hits % Bytes % Sessions Visitors Pages Errors
1 00:00 - 00:59
3,627    6.36%
0    0%
282 241 1,064 285
2 01:00 - 01:59
4,218    7.39%
0    0%
302 247 953 229
3 02:00 - 02:59
3,095    5.42%
0    0%
280 232 574 219
4 03:00 - 03:59
3,513    6.16%
0    0%
269 233 659 237
5 04:00 - 04:59
4,753    8.33%
0    0%
285 250 563 334
6 05:00 - 05:59
4,838    8.48%
0    0%
278 238 687 448
7 06:00 - 06:59
2,311    4.05%
0    0%
257 213 387 125
8 07:00 - 07:59
2,164    3.79%
0    0%
260 216 840 137
9 08:00 - 08:59
2,161    3.79%
0    0%
229 193 1,064 158
10 09:00 - 09:59
959    1.68%
0    0%
201 177 479 105
11 10:00 - 10:59
977    1.71%
0    0%
196 168 483 120
12 11:00 - 11:59
730    1.28%
0    0%
186 157 430 112
13 12:00 - 12:59
852    1.49%
0    0%
202 171 428 222
14 13:00 - 13:59
1,140    2.00%
0    0%
218 188 527 154
15 14:00 - 14:59
2,738    4.80%
0    0%
213 175 357 113
16 15:00 - 15:59
2,658    4.66%
0    0%
240 213 939 205
17 16:00 - 16:59
1,099    1.93%
0    0%
237 197 243 105
18 17:00 - 17:59
1,925    3.37%
0    0%
238 203 511 162
19 18:00 - 18:59
3,583    6.28%
0    0%
259 213 281 194
20 19:00 - 19:59
1,923    3.37%
0    0%
236 201 674 241
21 20:00 - 20:59
2,296    4.02%
0    0%
240 196 468 170
22 21:00 - 21:59
2,536    4.44%
0    0%
253 211 627 158
23 22:00 - 22:59
1,328    2.33%
0    0%
238 203 675 90
24 23:00 - 23:59
1,642    2.88%
0    0%
239 194 426 143
  Average
2,377    4.17%
0    0%
243 205 597 186
24 Totals
57,066    100%
0    0%
42,913 8,495 14,339 4,466
Go the Help Card.

Help Card: Friday Transmission
Report Overview This report details the hour-by-hour breakdown of traffic generated on all Fridays. Use this information to assess the damage of unforeseen downtime, or to find key traffic spikes that could be used to influence special features or promotions.

This report may be affected by world time zones. Many webservers generate timestamps in Greenwich Mean Time (GMT+0), which may not be your local time zone. The time data in your logs can be adjusted to represent your local time zone, in Settings > Analysis > Options > Date range > Time adjust.

Graph Description Vertical axis: Hits (default sorting).
Number of hits to the site. Changing the sorting options in Settings > Statistics will alter the vertical axis to the new sort method (Visitors, Bytes, etc). This report may be sorted by hits, bytes, sessions, visitors, pages or errors.

Horizontal axis: Time
The hour of the day.

Red line (if present):
HTTP errors (Page not found, server error, etc)

Table Description Time:
The hourly period of the corresponding day.

Hits (%):
Number of hits to the site during the corresponding hourly period. (Percentage as a proportion of hits to the site during the day's 24 hours.)

Bytes (%):
Number of bytes transferred as a result of hits to the site during the corresponding hourly period. For readability, these values may be suffixed with kilobytes (KB), megabytes (MB) or gigabytes (GB), where applicable. (Percentage as a proportion of bytes transferred during the day's 24 hours.)

Sessions:
Total number of sessions undertaken during the corresponding hourly period. This number includes sessions undertaken by 'repeat' visitors.

Visitors:
Total number of unique visitors who undertook one or more sessions during the corresponding hourly period. Note that this figure represents a unique hourly visitor count, not a unique daily visitor count (as a unique visitor for one hour may return in another hour). As such, the "Totals" value will be cumulative for the 24 hours and the overall totals for individual days may appear higher than expected.

Pages
Number of pages viewed during the corresponding hourly period.

Errors
Number of server errors generated as a result of hits to the site during the corresponding hourly period.

Go back to the top.

Copyright © Quest Software , 1997-2002