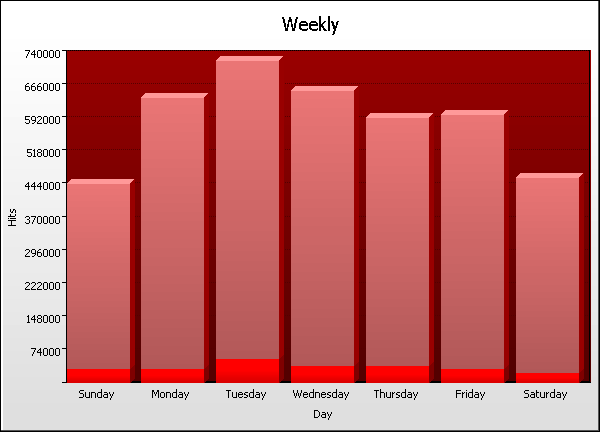
Day Graph
Go the Help Card.


Weekly
  Day Hits % Bytes % Sessions Visitors Pages Errors
1 Sunday
446,378    10.8%
0    0%
40,154 16,137 96,993 31,136
2 Monday
638,614    15.5%
0    0%
44,846 19,378 106,241 35,749
3 Tuesday
722,670    17.5%
0    0%
46,580 20,838 106,406 52,653
4 Wednesday
657,025    15.9%
0    0%
43,595 19,213 95,345 40,186
5 Thursday
596,021    14.5%
0    0%
39,542 17,881 108,620 38,413
6 Friday
601,718    14.6%
0    0%
38,980 16,645 99,623 33,588
7 Saturday
460,036    11.2%
0    0%
38,223 14,849 88,148 26,241
  Average
588,923    14.3%
0    0%
41,702 17,848 100,196 36,852
7 Totals
4,122,462    100%
0    0%
290,845 39,611 701,376 257,966
Go the Help Card.

Help Card: Weekly
Report Overview This report provides a snapshot of traffic for each day of the week. Use this information to find the most popular days of the week, which could then be targeted for special features or promotions. It can also be used to find the most appropriate time for maintenance downtime.

Graph Description Vertical axis: Hits (default sorting)
Hits to the site on the corresponding day of the week. Changing the sorting options in Settings > Statistics will alter the vertical axis to the new sort method (Visitors, Bytes, etc). This report can be sorted/graphed by hits, bytes, sessions, visitors, pages and errors.

This report may be affected by world time zones. Many webservers generate timestamps in Greenwich Mean Time (GMT+0), which may not be your local time zone. The time data in your logs can be adjusted to represent your local time zone, in Settings > Analysis > Options > Date range > Time adjust.

Horizontal axis: Day
Day of the week.

Red lines (if present):
HTTP errors (Page not found, server error, etc)

Table Description Day:
Day of the week being analyzed. Click on the hyperlink to view a detailed traffic report for the corresponding day.

Hits (%):
Number of hits generated on the corresponding day. (Percentage as a proportion of hits generated on all days of the week.)

Bytes (%):
Bytes transferred as a result of hits on the corresponding day. (Percentage as a proportion of bytes transferred on all days of the week.)

Sessions:
Total number of sessions undertaken during the corresponding weekly period. This number includes sessions undertaken by 'repeat' visitors. Note that he total of this column represents an overall session count for the entire period including those sessions overlapping weekly time periods. For this reason, the total of this column may appear smaller than the figure when adding up each row individually.

Visitors:
Total number of unique visitors who participated in one or more sessions during the corresponding weekly period. Note that this figure represents a unique visitor count, not a unique weekly visitor count (as a unique visitor for one week may return in another week). As such, the "Totals" value will be cumulative for the 24 hours and the overall total for individual rows may be more than in the Totals row.

Pages:
Number of pages viewed on the corresponding day.

Errors:
Errors generated as a result of hits to the site on the corresponding day.
Go back to the top.

Copyright © Quest Software , 1997-2002