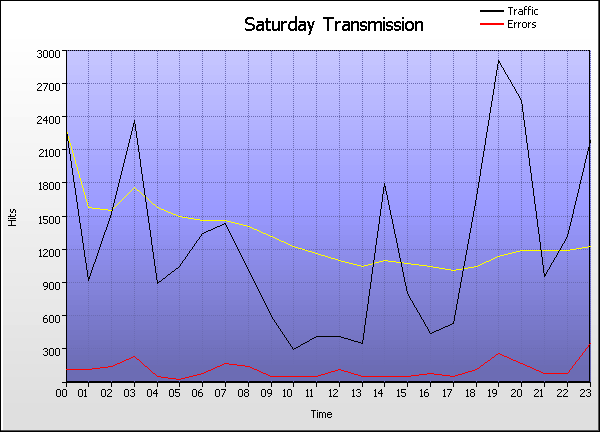
|
Saturday Transmission |
| |
Time |
Hits |
% |
Bytes |
% |
Sessions |
Visitors |
Pages |
Errors |
|
1 |
00:00 - 00:59 |
|
|
139 |
114 |
157 |
138 |
|
2 |
01:00 - 01:59 |
|
|
134 |
103 |
264 |
124 |
|
3 |
02:00 - 02:59 |
|
|
140 |
104 |
134 |
179 |
|
4 |
03:00 - 03:59 |
|
|
161 |
124 |
234 |
245 |
|
5 |
04:00 - 04:59 |
|
|
156 |
116 |
299 |
87 |
|
6 |
05:00 - 05:59 |
|
|
148 |
119 |
222 |
41 |
|
7 |
06:00 - 06:59 |
|
|
160 |
119 |
229 |
94 |
|
8 |
07:00 - 07:59 |
|
|
151 |
119 |
435 |
180 |
|
9 |
08:00 - 08:59 |
|
|
148 |
117 |
714 |
162 |
|
10 |
09:00 - 09:59 |
|
|
126 |
98 |
267 |
83 |
|
11 |
10:00 - 10:59 |
|
|
146 |
107 |
159 |
74 |
|
12 |
11:00 - 11:59 |
|
|
132 |
100 |
252 |
77 |
|
13 |
12:00 - 12:59 |
|
|
128 |
93 |
163 |
124 |
|
14 |
13:00 - 13:59 |
|
|
116 |
84 |
160 |
61 |
|
15 |
14:00 - 14:59 |
|
|
131 |
101 |
128 |
80 |
|
16 |
15:00 - 15:59 |
|
|
140 |
104 |
148 |
85 |
|
17 |
16:00 - 16:59 |
|
|
154 |
120 |
125 |
93 |
|
18 |
17:00 - 17:59 |
|
|
158 |
127 |
237 |
76 |
|
19 |
18:00 - 18:59 |
|
|
150 |
117 |
883 |
123 |
|
20 |
19:00 - 19:59 |
|
|
166 |
124 |
1,261 |
283 |
|
21 |
20:00 - 20:59 |
|
|
172 |
128 |
155 |
205 |
|
22 |
21:00 - 21:59 |
|
|
151 |
113 |
384 |
95 |
|
23 |
22:00 - 22:59 |
|
|
174 |
125 |
208 |
105 |
|
24 |
23:00 - 23:59 |
|
|
175 |
132 |
312 |
378 |
| |
Average |
|
|
148 |
112 |
313 |
133 |
|
24 |
Totals |
|
|
29,028 |
5,329 |
7,530 |
3,192 |
|
|