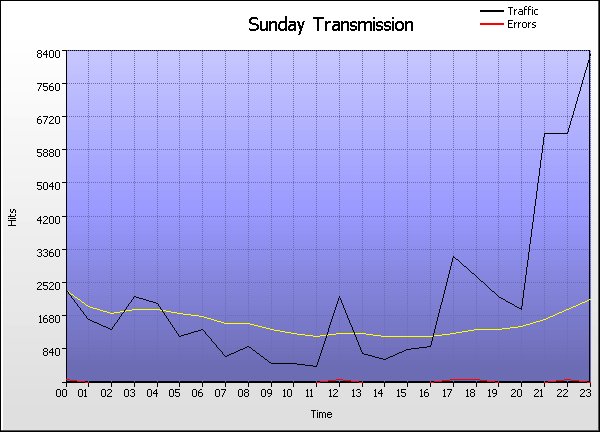
Time Graph
Go the Help Card.


Sunday Transmission
  Time Hits % Bytes % Sessions Visitors Pages Errors
1 00:00 - 00:59
2,382    4.57%
0    0%
196 165 743 155
2 01:00 - 01:59
1,644    3.15%
0    0%
191 140 897 55
3 02:00 - 02:59
1,407    2.70%
0    0%
175 144 398 69
4 03:00 - 03:59
2,210    4.24%
0    0%
182 148 351 41
5 04:00 - 04:59
2,048    3.93%
0    0%
199 154 379 66
6 05:00 - 05:59
1,236    2.37%
0    0%
185 151 424 64
7 06:00 - 06:59
1,386    2.66%
0    0%
190 159 349 46
8 07:00 - 07:59
751    1.44%
0    0%
161 134 306 31
9 08:00 - 08:59
974    1.87%
0    0%
152 120 319 44
10 09:00 - 09:59
578    1.11%
0    0%
146 119 346 54
11 10:00 - 10:59
524    1.00%
0    0%
147 119 321 43
12 11:00 - 11:59
427    <1%
0    0%
153 124 281 27
13 12:00 - 12:59
2,203    4.22%
0    0%
173 140 758 120
14 13:00 - 13:59
826    1.58%
0    0%
187 145 392 45
15 14:00 - 14:59
615    1.18%
0    0%
210 162 378 41
16 15:00 - 15:59
849    1.63%
0    0%
197 151 461 55
17 16:00 - 16:59
997    1.91%
0    0%
201 155 361 46
18 17:00 - 17:59
3,202    6.14%
0    0%
200 161 616 129
19 18:00 - 18:59
2,693    5.16%
0    0%
214 174 1,026 141
20 19:00 - 19:59
2,220    4.26%
0    0%
214 167 421 62
21 20:00 - 20:59
1,862    3.57%
0    0%
233 186 414 79
22 21:00 - 21:59
6,381    12.2%
0    0%
255 215 447 82
23 22:00 - 22:59
6,380    12.2%
0    0%
229 180 566 106
24 23:00 - 23:59
8,350    16.0%
0    0%
240 190 363 45
  Average
2,172    4.17%
0    0%
192 154 471 68
24 Totals
52,145    100.0%
0    0%
26,536 5,724 11,317 1,646
Go the Help Card.

Help Card: Sunday Transmission
Report Overview This report details the hour-by-hour breakdown of traffic generated on all Sundays. Use this information to assess the damage of unforeseen downtime, or to find key traffic spikes that could be used to influence special features or promotions.

This report may be affected by world time zones. Many webservers generate timestamps in Greenwich Mean Time (GMT+0), which may not be your local time zone. The time data in your logs can be adjusted to represent your local time zone, in Settings > Analysis > Options > Date range > Time adjust.

Graph Description Vertical axis: Hits (default sorting).
Number of hits to the site. Changing the sorting options in Settings > Statistics will alter the vertical axis to the new sort method (Visitors, Bytes, etc). This report may be sorted by hits, bytes, sessions, visitors, pages or errors.

Horizontal axis: Time
The hour of the day.

Red line (if present):
HTTP errors (Page not found, server error, etc)

Table Description Time:
The hourly period of the corresponding day.

Hits (%):
Number of hits to the site during the corresponding hourly period. (Percentage as a proportion of hits to the site during the day's 24 hours.)

Bytes (%):
Number of bytes transferred as a result of hits to the site during the corresponding hourly period. For readability, these values may be suffixed with kilobytes (KB), megabytes (MB) or gigabytes (GB), where applicable. (Percentage as a proportion of bytes transferred during the day's 24 hours.)

Sessions:
Total number of sessions undertaken during the corresponding hourly period. This number includes sessions undertaken by 'repeat' visitors.

Visitors:
Total number of unique visitors who undertook one or more sessions during the corresponding hourly period. Note that this figure represents a unique hourly visitor count, not a unique daily visitor count (as a unique visitor for one hour may return in another hour). As such, the "Totals" value will be cumulative for the 24 hours and the overall totals for individual days may appear higher than expected.

Pages
Number of pages viewed during the corresponding hourly period.

Errors
Number of server errors generated as a result of hits to the site during the corresponding hourly period.

Go back to the top.

Copyright © Quest Software , 1997-2002