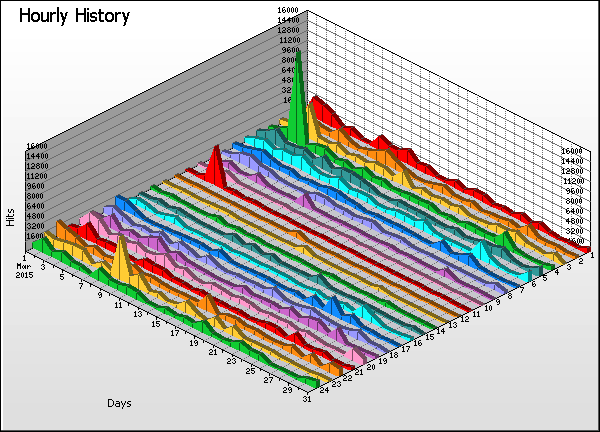
Time Graph
Go the Help Card.


Hourly History
  Time Hits % Bytes % Sessions Visitors Pages Errors
1 00:00 - 00:59
30,152    5.92%
0    0%
2,178 1,887 4,887 1,757
2 01:00 - 01:59
25,157    4.94%
0    0%
2,284 1,961 5,130 2,425
3 02:00 - 02:59
31,158    6.12%
0    0%
2,102 1,796 3,953 1,920
4 03:00 - 03:59
39,546    7.77%
0    0%
2,170 1,914 4,948 1,931
5 04:00 - 04:59
29,949    5.88%
0    0%
2,055 1,770 4,007 2,252
6 05:00 - 05:59
31,468    6.18%
0    0%
1,996 1,721 5,274 2,553
7 06:00 - 06:59
21,640    4.25%
0    0%
1,879 1,620 3,636 1,841
8 07:00 - 07:59
18,335    3.60%
0    0%
1,811 1,548 4,453 1,401
9 08:00 - 08:59
11,650    2.29%
0    0%
1,619 1,366 2,961 1,044
10 09:00 - 09:59
8,255    1.62%
0    0%
1,552 1,349 4,036 1,000
11 10:00 - 10:59
12,203    2.40%
0    0%
1,485 1,274 3,164 1,019
12 11:00 - 11:59
6,875    1.35%
0    0%
1,519 1,315 3,604 1,126
13 12:00 - 12:59
7,308    1.44%
0    0%
1,515 1,306 2,488 976
14 13:00 - 13:59
8,501    1.67%
0    0%
1,741 1,518 3,647 1,115
15 14:00 - 14:59
11,643    2.29%
0    0%
1,676 1,440 2,778 864
16 15:00 - 15:59
14,898    2.93%
0    0%
1,869 1,652 4,862 1,423
17 16:00 - 16:59
18,976    3.73%
0    0%
1,826 1,580 3,859 1,295
18 17:00 - 17:59
20,432    4.01%
0    0%
1,871 1,616 4,894 1,646
19 18:00 - 18:59
24,984    4.91%
0    0%
1,971 1,708 3,932 1,783
20 19:00 - 19:59
27,001    5.31%
0    0%
2,056 1,754 5,688 1,712
21 20:00 - 20:59
22,223    4.37%
0    0%
2,019 1,684 3,950 1,942
22 21:00 - 21:59
27,717    5.45%
0    0%
2,069 1,758 5,096 1,811
23 22:00 - 22:59
31,549    6.20%
0    0%
2,022 1,734 3,483 1,077
24 23:00 - 23:59
27,292    5.36%
0    0%
2,137 1,808 5,215 2,599
  Average
21,204    4.17%
0    0%
1,892 1,628 4,164 1,604
24 Totals
508,912    100%
0    0%
42,913 8,495 99,945 38,512
Go the Help Card.

Help Card: Hourly History
Report Overview This report highlights trends in the hour-by-hour usage of your web site over time. Use this information to assess whether there are noticeable periods of intense or calm traffic, which can influence future downtime considerations and/or special promotions.

This report may be affected by world time zones. Many webservers generate timestamps in Greenwich Mean Time (GMT+0), which may not be your local time zone. The time data in your logs can be adjusted to represent your local time zone, in Settings > Analysis > Options > Date range > Time adjust.

Graph Description Vertical axis: Hits (default sorting).
Changing the sorting options in Settings > Statistics will alter the vertical axis to the new sort method.

Horizontal axis: Days.
All days of the report period.

Depth (Z) axis: Hours.
The numbers along this axis correspond to the numbered entries in the table.

Table Description Time:
The hourly period as the focus of this report.

Hits (%):
Number of hits to the site during the corresponding hourly period. (Percentage as a proportion of hits to the site during the day's 24 hours.)

Bytes (%):
Number of bytes transferred as a result of hits to the site during the corresponding hourly period. For readability, these values may be suffixed with kilobytes (KB), megabytes (MB) or gigabytes (GB), where applicable. (Percentage as a proportion of bytes transferred during the day's 24 hours.)

Sessions:
Total number of sessions undertaken during the corresponding hourly period. This number includes sessions undertaken by 'repeat' visitors. Note that he total of this column represents an overall session count for the entire period including those sessions overlapping hourly time periods. For this reason, the total of this column may appear smaller than the figure when adding up each row individually.

Visitors:
Total number of unique visitors who participated in sessions during the corresponding hourly period. Note that this figure represents a unique hourly visitor count, not a unique daily visitor count (as a unique visitor for one hour may return in another hour). As such, the "Totals" value will be cumulative for the 24 hours and the overall total for individual rows may be more than in the Totals row..

Pages:
Number of pages viewed during the corresponding hourly period.

Errors:
Number of server errors generated as a result of hits to the site during the corresponding hourly period.
Go back to the top.

Copyright © Quest Software , 1997-2002