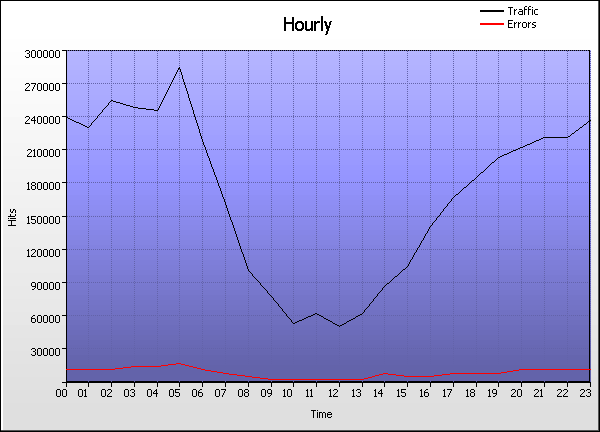
Time Graph
Go the Help Card.


Hourly
  Time Hits % Bytes % Sessions Visitors Pages Errors
1 00:00 - 00:59
242,488    5.88%
0    0%
14,483 11,910 31,093 13,616
2 01:00 - 01:59
232,274    5.63%
0    0%
14,481 12,014 31,604 13,323
3 02:00 - 02:59
256,777    6.23%
0    0%
14,519 11,929 28,576 13,527
4 03:00 - 03:59
251,900    6.11%
0    0%
14,999 12,488 31,156 15,952
5 04:00 - 04:59
248,300    6.02%
0    0%
14,738 12,063 29,643 16,700
6 05:00 - 05:59
287,298    6.97%
0    0%
14,976 12,267 35,920 19,019
7 06:00 - 06:59
219,377    5.32%
0    0%
14,124 11,469 32,470 13,593
8 07:00 - 07:59
164,856    4.00%
0    0%
12,800 10,525 28,711 10,053
9 08:00 - 08:59
102,964    2.50%
0    0%
11,233 9,091 24,045 7,566
10 09:00 - 09:59
79,277    1.92%
0    0%
10,916 8,987 28,610 5,829
11 10:00 - 10:59
56,962    1.38%
0    0%
10,186 8,292 24,576 4,880
12 11:00 - 11:59
63,445    1.54%
0    0%
10,562 8,724 25,154 4,454
13 12:00 - 12:59
52,490    1.27%
0    0%
10,338 8,348 23,761 4,960
14 13:00 - 13:59
63,541    1.54%
0    0%
10,824 8,799 26,742 4,367
15 14:00 - 14:59
88,078    2.14%
0    0%
10,950 8,940 29,206 10,087
16 15:00 - 15:59
107,530    2.61%
0    0%
11,822 9,695 27,323 7,035
17 16:00 - 16:59
142,382    3.45%
0    0%
12,600 10,326 27,316 8,894
18 17:00 - 17:59
168,638    4.09%
0    0%
14,032 11,652 29,824 10,163
19 18:00 - 18:59
188,912    4.58%
0    0%
13,861 11,371 31,039 11,838
20 19:00 - 19:59
206,191    5.00%
0    0%
14,211 11,727 32,894 11,070
21 20:00 - 20:59
214,266    5.20%
0    0%
13,683 11,249 28,637 12,352
22 21:00 - 21:59
223,842    5.43%
0    0%
14,279 11,775 32,900 12,365
23 22:00 - 22:59
222,486    5.40%
0    0%
14,113 11,531 28,940 12,972
24 23:00 - 23:59
238,188    5.78%
0    0%
14,606 12,068 31,236 13,351
  Average
171,769    4.17%
0    0%
13,055 10,718 29,224 10,748
24 Totals
4,122,462    100%
0    0%
290,845 39,611 701,376 257,966
Go the Help Card.

Help Card: Hourly
Report Overview This report provides a snapshot of traffic for each hour of the day. Use this information to find the most popular hours, which can be used to determine when system uptime is most crucial.

This report may be affected by world time zones. Many webservers generate timestamps in Greenwich Mean Time (GMT+0), which may not be your local time zone. The time data in your logs can be adjusted to represent your local time zone, in Settings > Analysis > Options > Date range > Time adjust.

Graph Description Vertical axis: Hits (default sorting).
Number of hits to the site. Changing the sorting options in Settings > Statistics will alter the vertical axis to the new sort method (Visitors, Bytes, etc). This report may be sorted by hits, bytes, sessions, visitors, pages or errors.

Horizontal axis: Time
The hourly periods of a day.

Red line (if present):
HTTP errors (Page not found, server error, etc)

Table Description Time:
The hourly period as the focus of this report.

Hits (%):
Number of hits to the site during the corresponding hourly period. (Percentage as a proportion of hits to the site during the day's 24 hours.)

Bytes (%):
Number of bytes transferred as a result of hits to the site during the corresponding hourly period. For readability, these values may be suffixed with kilobytes (KB), megabytes (MB) or gigabytes (GB), where applicable. (Percentage as a proportion of bytes transferred during the day's 24 hours.)

Sessions:
Total number of sessions undertaken during the corresponding hourly period. This number includes sessions undertaken by 'repeat' visitors. Note that he total of this column represents an overall session count for the entire period including those sessions overlapping hourly time periods. For this reason, the total of this column may appear smaller than the figure when adding up each row individually.

Visitors:
Total number of unique visitors who participated in sessions during the corresponding hourly period. Note that this figure represents a unique hourly visitor count, not a unique daily visitor count (as a unique visitor for one hour may return in another hour). As such, the "Totals" value will be cumulative for the 24 hours and the overall total for individual rows may be more than in the Totals row.

Pages:
Number of pages viewed during the corresponding hourly period.

Errors:
Number of server errors generated as a result of hits to the site during the corresponding hourly period.
Go back to the top.

Copyright © Quest Software , 1997-2002