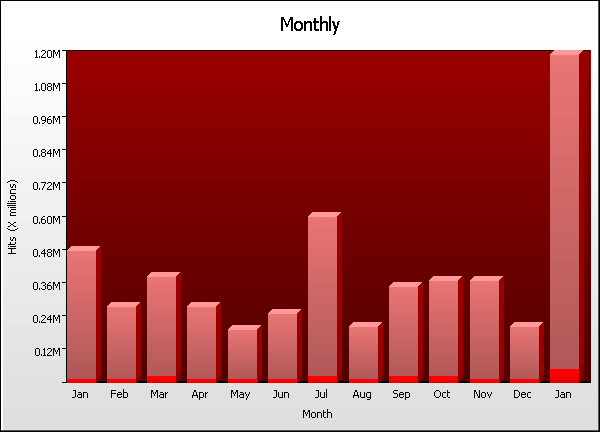
Month Graph
Go the Help Card.


Monthly
  Month Hits % Bytes % Sessions Visitors Pages Errors
1 Jan
488,970    9.35%
0    0%
14,178 3,247 52,977 23,466
2 Feb
281,861    5.39%
0    0%
15,256 4,282 53,579 21,010
3 Mar
394,292    7.54%
0    0%
21,868 5,327 72,549 28,418
4 Apr
285,383    5.46%
0    0%
19,326 5,218 41,658 13,220
5 May
196,864    3.77%
0    0%
22,024 4,896 43,051 14,780
6 Jun
253,197    4.84%
0    0%
29,499 4,130 41,956 15,972
7 Jul
606,596    11.6%
0    0%
25,065 4,240 79,174 33,397
8 Aug
207,003    3.96%
0    0%
23,391 3,856 38,188 13,660
9 Sep
351,440    6.72%
0    0%
29,028 5,329 42,579 31,208
10 Oct
380,653    7.28%
0    0%
26,358 5,831 68,409 29,031
11 Nov
376,146    7.19%
0    0%
26,536 5,724 63,232 12,956
12 Dec
209,768    4.01%
0    0%
26,706 4,353 59,234 15,798
13 Jan
1,196,022    22.9%
0    0%
33,975 5,345 57,574 56,519
  Average
402,168    7.69%
0    0%
24,093 4,752 54,935 23,802
13 Totals
5,228,195    100.0%
0    0%
313,179 42,289 714,160 309,435
Go the Help Card.

Help Card: Monthly
Report Overview This report shows a month-by-month summary of all dates in your report period. Use this information to evaluate the effects of unusual or dramatic events that may have caused fluctuations in site traffic. The assessment of low and high traffic periods should be correlated against month-to-month objectives of your web site.

This report may be affected by world time zones. Many webservers generate timestamps in Greenwich Mean Time (GMT+0), which may not be your local time zone. The time data in your logs can be adjusted to represent your local time zone, in Settings > Analysis > Options > Date range > Time adjust.

Graph Description Vertical axis: Hits (default sorting).
Number of hits to the site. Changing the sorting options in Settings > Statistics will alter the vertical axis to the new sort method (Visitors, Bytes, etc). This report may be sorted by hits, bytes, sessions, visitors, pages or errors.

Horizontal axis: Date.
Representative of all months in the report period.

Red line (if present):
HTTP errors (Page not found, server error, etc)


Table Description Date:
Specfic month as the focus of analysis.

Hits (%):
Number of hits to the web site during the corresponding month. (Percentage as a proportion of hits generated during all months in the report period.)

Bytes (%):
Bytes transferred as a result of hits during the corresponding month. (Percentage as a proportion of bytes transferred during all months in the report period.)

Sessions:
Total number of sessions undertaken during the corresponding month. This number includes sessions undertaken by 'repeat' visitors, that is, it is not representative of a 'unique' session count.

Visitors:
Total number of unique visitors who undertook one or more sessions during the corresponding month. Note that this figure represents a unique monthly visitor count, not a unique yearly visitor count (as a unique visitor for one month may return during another month). As such, the "Totals" value will be cumulative for all months (monthly uniqueness is disregarded) and the overall value may therefore appear higher than expected.

Pages:
Number of pages viewed during the corresponding month.

Errors:
Errors generated as a result of hits to the site during the corresponding month.
Go back to the top.

Copyright © Quest Software , 1997-2002