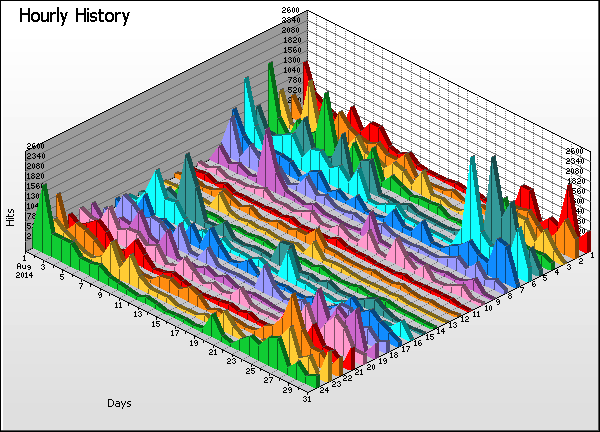
Time Graph
Go the Help Card.


Hourly History
  Time Hits % Bytes % Sessions Visitors Pages Errors
1 00:00 - 00:59
11,500    5.56%
0    0%
1,101 909 1,812 755
2 01:00 - 01:59
10,227    4.94%
0    0%
1,038 862 1,375 599
3 02:00 - 02:59
11,332    5.47%
0    0%
1,072 881 1,183 484
4 03:00 - 03:59
12,412    6.00%
0    0%
1,081 897 1,660 1,213
5 04:00 - 04:59
14,296    6.91%
0    0%
1,045 866 1,457 1,135
6 05:00 - 05:59
15,882    7.67%
0    0%
1,068 883 1,753 1,055
7 06:00 - 06:59
10,204    4.93%
0    0%
1,021 857 2,080 770
8 07:00 - 07:59
7,159    3.46%
0    0%
972 820 2,205 415
9 08:00 - 08:59
5,569    2.69%
0    0%
877 730 1,231 347
10 09:00 - 09:59
4,476    2.16%
0    0%
871 723 1,404 209
11 10:00 - 10:59
2,297    1.11%
0    0%
891 724 1,248 253
12 11:00 - 11:59
3,679    1.78%
0    0%
899 743 1,453 203
13 12:00 - 12:59
2,652    1.28%
0    0%
873 706 1,201 247
14 13:00 - 13:59
2,930    1.42%
0    0%
872 715 1,406 270
15 14:00 - 14:59
7,762    3.75%
0    0%
943 789 1,835 524
16 15:00 - 15:59
6,973    3.37%
0    0%
998 817 1,502 390
17 16:00 - 16:59
7,566    3.66%
0    0%
1,002 832 1,094 577
18 17:00 - 17:59
9,094    4.39%
0    0%
1,119 941 1,460 558
19 18:00 - 18:59
9,177    4.43%
0    0%
1,107 931 1,392 521
20 19:00 - 19:59
10,355    5.00%
0    0%
1,109 920 1,613 555
21 20:00 - 20:59
8,630    4.17%
0    0%
1,064 868 1,438 485
22 21:00 - 21:59
11,575    5.59%
0    0%
1,087 899 2,024 632
23 22:00 - 22:59
10,097    4.88%
0    0%
1,082 896 1,852 1,005
24 23:00 - 23:59
11,159    5.39%
0    0%
1,092 900 2,510 458
  Average
8,625    4.17%
0    0%
1,011 837 1,591 569
24 Totals
207,003    100.0%
0    0%
23,391 3,856 38,188 13,660
Go the Help Card.

Help Card: Hourly History
Report Overview This report highlights trends in the hour-by-hour usage of your web site over time. Use this information to assess whether there are noticeable periods of intense or calm traffic, which can influence future downtime considerations and/or special promotions.

This report may be affected by world time zones. Many webservers generate timestamps in Greenwich Mean Time (GMT+0), which may not be your local time zone. The time data in your logs can be adjusted to represent your local time zone, in Settings > Analysis > Options > Date range > Time adjust.

Graph Description Vertical axis: Hits (default sorting).
Changing the sorting options in Settings > Statistics will alter the vertical axis to the new sort method.

Horizontal axis: Days.
All days of the report period.

Depth (Z) axis: Hours.
The numbers along this axis correspond to the numbered entries in the table.

Table Description Time:
The hourly period as the focus of this report.

Hits (%):
Number of hits to the site during the corresponding hourly period. (Percentage as a proportion of hits to the site during the day's 24 hours.)

Bytes (%):
Number of bytes transferred as a result of hits to the site during the corresponding hourly period. For readability, these values may be suffixed with kilobytes (KB), megabytes (MB) or gigabytes (GB), where applicable. (Percentage as a proportion of bytes transferred during the day's 24 hours.)

Sessions:
Total number of sessions undertaken during the corresponding hourly period. This number includes sessions undertaken by 'repeat' visitors. Note that he total of this column represents an overall session count for the entire period including those sessions overlapping hourly time periods. For this reason, the total of this column may appear smaller than the figure when adding up each row individually.

Visitors:
Total number of unique visitors who participated in sessions during the corresponding hourly period. Note that this figure represents a unique hourly visitor count, not a unique daily visitor count (as a unique visitor for one hour may return in another hour). As such, the "Totals" value will be cumulative for the 24 hours and the overall total for individual rows may be more than in the Totals row..

Pages:
Number of pages viewed during the corresponding hourly period.

Errors:
Number of server errors generated as a result of hits to the site during the corresponding hourly period.
Go back to the top.

Copyright © Quest Software , 1997-2002