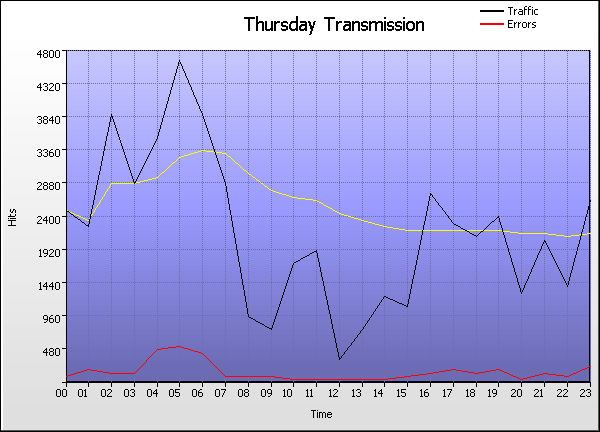
|
Thursday Transmission |
| |
Time |
Hits |
% |
Bytes |
% |
Sessions |
Visitors |
Pages |
Errors |
|
1 |
00:00 - 00:59 |
|
|
192 |
149 |
440 |
109 |
|
2 |
01:00 - 01:59 |
|
|
186 |
138 |
227 |
228 |
|
3 |
02:00 - 02:59 |
|
|
183 |
143 |
175 |
166 |
|
4 |
03:00 - 03:59 |
|
|
200 |
165 |
272 |
165 |
|
5 |
04:00 - 04:59 |
|
|
181 |
148 |
184 |
496 |
|
6 |
05:00 - 05:59 |
|
|
174 |
138 |
201 |
566 |
|
7 |
06:00 - 06:59 |
|
|
164 |
130 |
158 |
443 |
|
8 |
07:00 - 07:59 |
|
|
122 |
101 |
116 |
106 |
|
9 |
08:00 - 08:59 |
|
|
131 |
100 |
302 |
109 |
|
10 |
09:00 - 09:59 |
|
|
136 |
112 |
160 |
123 |
|
11 |
10:00 - 10:59 |
|
|
142 |
112 |
128 |
86 |
|
12 |
11:00 - 11:59 |
|
|
123 |
99 |
145 |
75 |
|
13 |
12:00 - 12:59 |
|
|
121 |
103 |
121 |
76 |
|
14 |
13:00 - 13:59 |
|
|
121 |
100 |
141 |
80 |
|
15 |
14:00 - 14:59 |
|
|
153 |
123 |
145 |
86 |
|
16 |
15:00 - 15:59 |
|
|
132 |
108 |
206 |
126 |
|
17 |
16:00 - 16:59 |
|
|
175 |
137 |
148 |
159 |
|
18 |
17:00 - 17:59 |
|
|
174 |
141 |
170 |
234 |
|
19 |
18:00 - 18:59 |
|
|
165 |
137 |
580 |
182 |
|
20 |
19:00 - 19:59 |
|
|
168 |
136 |
162 |
221 |
|
21 |
20:00 - 20:59 |
|
|
169 |
133 |
132 |
68 |
|
22 |
21:00 - 21:59 |
|
|
158 |
134 |
229 |
157 |
|
23 |
22:00 - 22:59 |
|
|
169 |
140 |
190 |
112 |
|
24 |
23:00 - 23:59 |
|
|
171 |
142 |
224 |
277 |
| |
Average |
|
|
158 |
127 |
206 |
185 |
|
24 |
Totals |
|
|
29,028 |
5,329 |
4,956 |
4,450 |
|
|