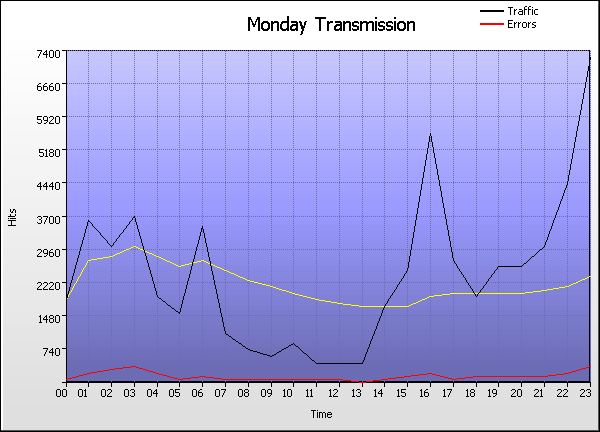
Time Graph
Go the Help Card.


Monday Transmission
  Time Hits % Bytes % Sessions Visitors Pages Errors
1 00:00 - 00:59
1,869    3.16%
0    0%
257 204 270 127
2 01:00 - 01:59
3,682    6.22%
0    0%
263 198 374 249
3 02:00 - 02:59
3,083    5.21%
0    0%
260 195 539 328
4 03:00 - 03:59
3,753    6.34%
0    0%
298 235 376 414
5 04:00 - 04:59
1,972    3.33%
0    0%
242 189 306 249
6 05:00 - 05:59
1,562    2.64%
0    0%
251 185 490 120
7 06:00 - 06:59
3,530    5.96%
0    0%
234 176 201 173
8 07:00 - 07:59
1,148    1.94%
0    0%
223 174 312 80
9 08:00 - 08:59
813    1.37%
0    0%
220 161 264 145
10 09:00 - 09:59
658    1.11%
0    0%
185 137 240 76
11 10:00 - 10:59
934    1.58%
0    0%
186 140 223 82
12 11:00 - 11:59
447    <1%
0    0%
186 135 210 81
13 12:00 - 12:59
481    <1%
0    0%
163 121 249 96
14 13:00 - 13:59
507    <1%
0    0%
182 131 234 69
15 14:00 - 14:59
1,728    2.92%
0    0%
209 160 207 86
16 15:00 - 15:59
2,523    4.26%
0    0%
202 155 217 174
17 16:00 - 16:59
5,600    9.46%
0    0%
270 220 228 248
18 17:00 - 17:59
2,786    4.71%
0    0%
269 211 340 131
19 18:00 - 18:59
1,992    3.36%
0    0%
255 203 242 184
20 19:00 - 19:59
2,630    4.44%
0    0%
277 219 484 195
21 20:00 - 20:59
2,636    4.45%
0    0%
251 189 216 158
22 21:00 - 21:59
3,096    5.23%
0    0%
237 185 260 200
23 22:00 - 22:59
4,449    7.52%
0    0%
256 193 229 231
24 23:00 - 23:59
7,319    12.4%
0    0%
252 191 248 399
  Average
2,466    4.17%
0    0%
234 179 289 178
24 Totals
59,198    100%
0    0%
29,028 5,329 6,959 4,295
Go the Help Card.

Help Card: Monday Transmission
Report Overview This report details the hour-by-hour breakdown of traffic generated on all Mondays. Use this information to assess the damage of unforeseen downtime, or to find key traffic spikes that could be used to influence special features or promotions.

This report may be affected by world time zones. Many webservers generate timestamps in Greenwich Mean Time (GMT+0), which may not be your local time zone. The time data in your logs can be adjusted to represent your local time zone, in Settings > Analysis > Options > Date range > Time adjust.

Graph Description Vertical axis: Hits (default sorting).
Number of hits to the site. Changing the sorting options in Settings > Statistics will alter the vertical axis to the new sort method (Visitors, Bytes, etc). This report may be sorted by hits, bytes, sessions, visitors, pages or errors.

Horizontal axis: Time
The hour of the day.

Red line (if present):
HTTP errors (Page not found, server error, etc)

Table Description Time:
The hourly period of the corresponding day.

Hits (%):
Number of hits to the site during the corresponding hourly period. (Percentage as a proportion of hits to the site during the day's 24 hours.)

Bytes (%):
Number of bytes transferred as a result of hits to the site during the corresponding hourly period. For readability, these values may be suffixed with kilobytes (KB), megabytes (MB) or gigabytes (GB), where applicable. (Percentage as a proportion of bytes transferred during the day's 24 hours.)

Sessions:
Total number of sessions undertaken during the corresponding hourly period. This number includes sessions undertaken by 'repeat' visitors.

Visitors:
Total number of unique visitors who undertook one or more sessions during the corresponding hourly period. Note that this figure represents a unique hourly visitor count, not a unique daily visitor count (as a unique visitor for one hour may return in another hour). As such, the "Totals" value will be cumulative for the 24 hours and the overall totals for individual days may appear higher than expected.

Pages
Number of pages viewed during the corresponding hourly period.

Errors
Number of server errors generated as a result of hits to the site during the corresponding hourly period.

Go back to the top.

Copyright © Quest Software , 1997-2002