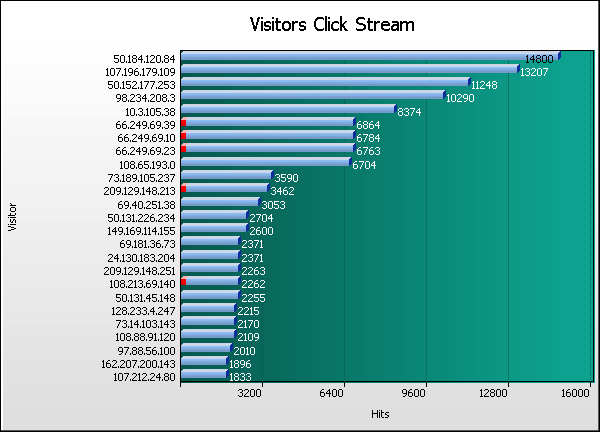
Visitor Graph
Go the Help Card.


NOTE: Click on a visitor to show individual session history
Visitors Click Stream
  Visitor Hits % Bytes % Sessions Mean Time Pages Errors
1 50.184.120.84
14,800    3.93%
0    0%
8 13:47 6 54
2 107.196.179.109
13,207    3.51%
0    0%
12 17:36 11 93
3 50.152.177.253
11,248    2.99%
0    0%
4 22:46 0 0
4 98.234.208.3
10,290    2.74%
0    0%
4 17:49 4 29
5 10.3.105.38
8,374    2.23%
0    0%
2 359:25:15 8,374 0
6 66.249.69.39
6,864    1.82%
0    0%
764 24:08 5,732 229
7 66.249.69.10
6,784    1.80%
0    0%
776 23:42 5,667 197
8 66.249.69.23
6,763    1.80%
0    0%
775 23:40 5,659 182
9 108.65.193.0
6,704    1.78%
0    0%
17 12:22 10 119
10 73.189.105.237
3,590    <1%
0    0%
14 02:38 0 0
11 209.129.148.213
3,462    <1%
0    0%
112 04:11 113 281
12 69.40.251.38
3,053    <1%
0    0%
3 01:47 0 3
13 50.131.226.234
2,704    <1%
0    0%
4 29:26 6 32
14 149.169.114.155
2,600    <1%
0    0%
1 05:23 0 0
15 69.181.36.73
2,371    <1%
0    0%
20 15:07 23 69
16 24.130.183.204
2,371    <1%
0    0%
32 10:35 29 20
17 209.129.148.251
2,263    <1%
0    0%
50 06:40 122 111
18 108.213.69.140
2,262    <1%
0    0%
11 31:13 15 207
19 50.131.45.148
2,255    <1%
0    0%
34 10:56 61 64
20 128.233.4.247
2,215    <1%
0    0%
9 01:44 0 1
21 73.14.103.143
2,170    <1%
0    0%
1 05:36 0 0
22 108.88.91.120
2,109    <1%
0    0%
11 12:10 100 125
23 97.88.56.100
2,010    <1%
0    0%
2 01:40 0 0
24 162.207.200.143
1,896    <1%
0    0%
19 13:15 62 140
25 107.212.24.80
1,833    <1%
0    0%
19 17:47 15 32
26 72.213.185.207
1,717    <1%
0    0%
2 02:20 0 0
27 69.106.230.158
1,663    <1%
0    0%
21 14:42 15 1
28 211.107.191.111
1,641    <1%
0    0%
2 04:02 0 0
29 68.180.228.180
1,564    <1%
0    0%
731 03:07 948 240
30 66.249.67.135
1,521    <1%
0    0%
51 50:41 1,316 71
31 66.249.67.151
1,511    <1%
0    0%
48 53:28 1,299 73
32 24.130.220.220
1,510    <1%
0    0%
14 14:57 12 50
33 66.249.67.143
1,506    <1%
0    0%
41 01:05:23 1,260 73
34 108.206.33.112
1,498    <1%
0    0%
13 12:49 12 69
35 174.29.18.208
1,473    <1%
0    0%
2 05:09 0 4
36 97.84.69.146
1,467    <1%
0    0%
20 14:20 10 52
37 69.181.126.98
1,441    <1%
0    0%
12 11:46 15 7
38 68.3.70.123
1,402    <1%
0    0%
1 01:42 0 0
39 86.97.42.29
1,397    <1%
0    0%
1 10:28 0 0
40 98.207.236.94
1,369    <1%
0    0%
14 13:27 15 48
  Subtotals
146,878    39.0%
0    0%
3,677 1892:29:42 30,911 2,676
5,684 Others
229,268    61.0%
0    0%
22,859 940:05:41 32,321 10,280
  Average
65    <1%
0    0%
4 06:24 11 2
5,724 Totals
376,146    100%
0    0%
26,536 35:23 63,232 12,956
Go the Help Card.

Help Card: Visitors Click Stream
Report Overview This extremely powerful report allows you to drill down through every page viewed within every session undertaken by your site visitors. It can be particularly useful in assessing the behavioral trends of key visitors, and can help in the planning of new site content. This report can also assist in the enforcement of acceptable use policies in an Intranet environment (allowing administrators to hone in on individual users).

If only IP addresses (such as 192.77.210.55) are showing in the report, then you may need to enable DNS lookups, in Settings > Analysis > Network > DNS. Bear in mind that not all IP addresses on the Internet have a name associated with them.

Note: one visitor address or hostname may actually represent multiple visitors, and at times, hundreds or even thousands of visitors. This is due to the widespread usage of proxy servers, which store web sites to enable faster and cheaper access for those utilizing it. This problem can be overcome through the use of authenticating procedures (visitors logging in to the site with a username and password), or, in part, through the use of cookies.

Graph Description Vertical axis: Visitor.
IP address or hostname of the visitor being analyzed.

Horizontal axis: Hits (default sorting).
Hits to the site by the corresponding visitor. Changing the sorting options in Settings > Statistics will alter the horizontal axis to the new sort method. This report can be sorted/graphed by hits, bytes, sessions, pages and errors.

Red lines (if present):
HTTP errors (Page not found, server error, etc)

Table Description Visitor:
IP address or hostname of the visitor being analyzed. Click the hyperlink to view the visitor's session click streams. The resultant report will open in a new browser window.

Hits (%):
Number of hits to the site by the corresponding visitor. (Percentage as a proportion of hits to the site by all visitors.)

Sessions:
Number of sessions undertaken by the corresponding visitor.

Mean time:
The average time spent on the website during each session undertaken by the corresponding visitor. It is represented in hours, minutes and seconds (HH:MM:SS).

Pages:
Number of pages viewed by the corresponding site visitor.

Errors:
Errors generated as a result of hits to the site by the corresponding visitor.
Go back to the top.

Copyright © Quest Software , 1997-2002