This report highlights the most popular video clips being accessed on your site over time. This includes both streamed files and downloaded sound files. Use this information to assess any unusual trends in bandwidth consumption - video clips are generally quite large in size, and will apply greater pressure on your Internet connection than normal web pages.
Note that for a file to be recognized as an video clip, its extension (such as .wma) must be specified in Settings > Analysis > Extensions > Video.
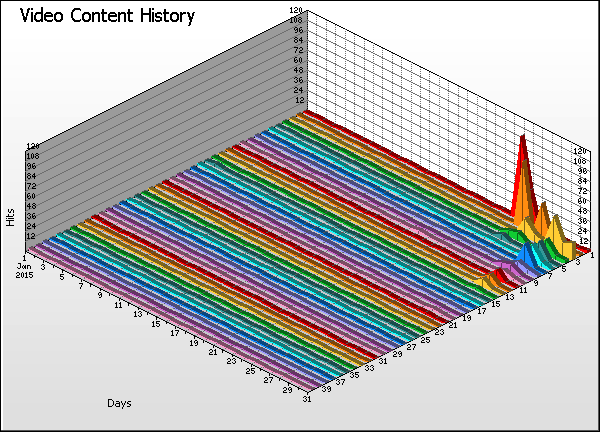
Vertical axis: Hits (default sorting).
Changing the sorting options in Settings > Statistics will alter the vertical axis to the new sort method. This report can be sorted/graphed by hits, bytes or errors.
Horizontal axis: Days.
All days of the report period.
Depth (Z) axis: Video Clips.
The numbers along this axis correspond to the numbered entries in the table.
Files: URL of the video clip being analyzed.
Hits (%): Number of hits to the corresponding video clip. (Percentage as a proportion of hits to all video clips.)
Bytes (%): Bytes transferred as a result of hits to the corresponding video clip. (Percentage as a proportion of bytes transferred for all video clips.)
Errors: Errors generated as a result of hits to the corresponding video clip.