|
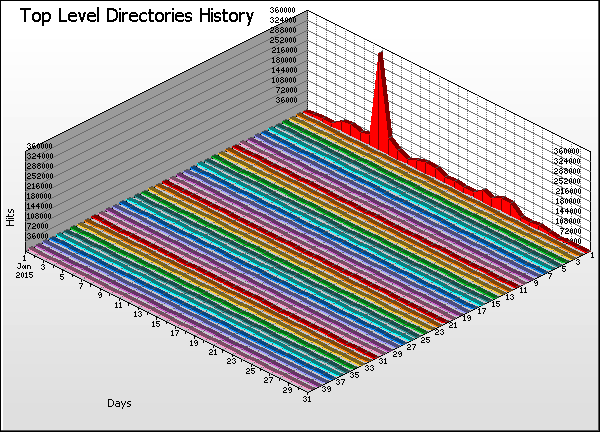
Top Level Directories History |
| |
Directory |
Hits |
% |
Bytes |
% |
Pages |
Errors |
|
1 |
/mspeck/ |
|
|
10,233 |
47,975 |
|
2 |
/jburrell/ |
|
|
203 |
30 |
|
3 |
/library/ |
|
|
1,904 |
546 |
|
4 |
/mchan/ |
|
|
7,786 |
576 |
|
5 |
/hit/ |
|
|
7,027 |
79 |
|
6 |
/jhui/ |
|
|
198 |
28 |
|
7 |
/jdelfrate/ |
|
|
4,642 |
521 |
|
8 |
/mgarrett/ |
|
|
2,730 |
152 |
|
9 |
/rhulbert/ |
|
|
517 |
182 |
|
10 |
/hsun/ |
|
|
255 |
74 |
|
11 |
/dlamkin/ |
|
|
134 |
21 |
|
12 |
/mmeyer/ |
|
|
130 |
29 |
|
13 |
/plouraille/ |
|
|
119 |
27 |
|
14 |
/phudak/ |
|
|
850 |
28 |
|
15 |
/jeffrey/ |
|
|
708 |
32 |
|
16 |
/allcollege3/ |
|
|
576 |
81 |
|
17 |
/jelliott/ |
|
|
120 |
74 |
|
18 |
/allcollege2/ |
|
|
452 |
60 |
|
19 |
/math/ |
|
|
276 |
147 |
|
20 |
/shuerta/ |
|
|
110 |
58 |
|
21 |
/college_pres/ |
|
|
344 |
57 |
|
22 |
/test/ |
|
|
258 |
100 |
|
23 |
/embed/ |
|
|
223 |
9 |
|
24 |
/dguich/ |
|
|
136 |
22 |
|
25 |
/cindy/ |
|
|
230 |
29 |
|
26 |
/cbrockmeier/ |
|
|
130 |
43 |
|
27 |
/rrivas/ |
|
|
94 |
16 |
|
28 |
/curtis/ |
|
|
230 |
21 |
|
29 |
/mthoppay/ |
|
|
212 |
41 |
|
30 |
/allcollege/ |
|
|
177 |
38 |
|
31 |
/flex_day/ |
|
|
184 |
27 |
|
32 |
/smanske/ |
|
|
117 |
18 |
|
33 |
/pgnehm/ |
|
|
111 |
53 |
|
34 |
/test1/ |
|
|
147 |
32 |
|
35 |
/hrandall/ |
|
|
115 |
27 |
|
36 |
/ebell/ |
|
|
119 |
19 |
|
37 |
/wabdeljabbar/ |
|
|
116 |
16 |
|
38 |
/dpiper/ |
|
|
133 |
20 |
|
39 |
/jyu/ |
|
|
116 |
19 |
|
40 |
/mkim/ |
|
|
118 |
24 |
| |
Subtotals |
|
|
42,280 |
51,351 |
|
294 |
Others |
|
|
3,720 |
1,499 |
| |
Average |
|
|
137 |
158 |
|
334 |
Totals |
|
|
46,000 |
52,850 |
|
|