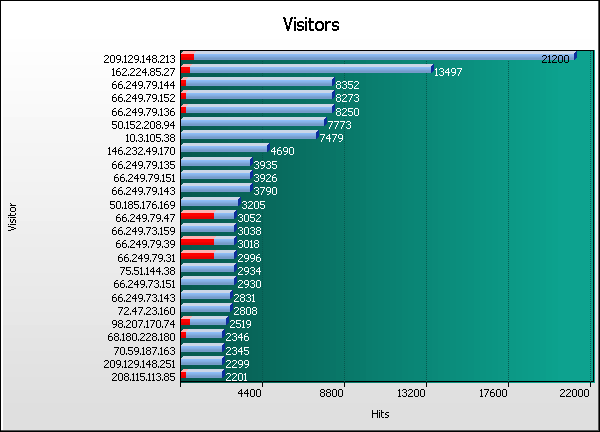
Visitor Graph
Go the Help Card.


Visitors
  Visitor Hits % Bytes % Sessions Mean Time Pages Errors
1 209.129.148.213
21,200    4.46%
0    0%
160 05:30 213 685
2 162.224.85.27
13,497    2.84%
0    0%
21 18:46 14 564
3 66.249.79.144
8,352    1.76%
0    0%
104 02:49:57 6,663 328
4 66.249.79.152
8,273    1.74%
0    0%
94 03:09:01 6,636 298
5 66.249.79.136
8,250    1.74%
0    0%
103 02:52:08 6,681 301
6 50.152.208.94
7,773    1.64%
0    0%
7 12:52 4 217
7 10.3.105.38
7,479    1.57%
0    0%
1 671:57:35 7,479 0
8 146.232.49.170
4,690    <1%
0    0%
1 38:18 0 0
9 66.249.79.135
3,935    <1%
0    0%
125 58:04 3,001 216
10 66.249.79.151
3,926    <1%
0    0%
120 59:57 2,955 201
11 66.249.79.143
3,790    <1%
0    0%
146 47:33 2,868 219
12 50.185.176.169
3,205    <1%
0    0%
6 11:37 4 135
13 66.249.79.47
3,052    <1%
0    0%
517 18:41 2,587 1,938
14 66.249.73.159
3,038    <1%
0    0%
51 02:10:17 2,403 51
15 66.249.79.39
3,018    <1%
0    0%
548 16:47 2,580 1,950
16 66.249.79.31
2,996    <1%
0    0%
535 17:34 2,554 1,930
17 75.51.144.38
2,934    <1%
0    0%
31 04:33 0 0
18 66.249.73.151
2,930    <1%
0    0%
52 02:09:45 2,291 51
19 66.249.73.143
2,831    <1%
0    0%
56 01:58:34 2,231 46
20 72.47.23.160
2,808    <1%
0    0%
1 03:55 0 0
21 98.207.170.74
2,519    <1%
0    0%
17 10:19 17 556
22 68.180.228.180
2,346    <1%
0    0%
649 02:48 1,761 221
23 70.59.187.163
2,345    <1%
0    0%
16 16:33 12 69
24 209.129.148.251
2,299    <1%
0    0%
64 03:27 225 79
25 208.115.113.85
2,201    <1%
0    0%
465 04:46 2,072 321
26 63.152.212.162
2,172    <1%
0    0%
3 01:46 0 1
27 216.58.35.252
2,145    <1%
0    0%
2 06:17 0 1
28 208.115.111.69
2,122    <1%
0    0%
462 04:00 1,999 321
29 160.253.0.8
2,024    <1%
0    0%
1 01:57 0 0
30 50.174.250.173
1,939    <1%
0    0%
12 14:45 14 182
31 76.102.252.16
1,929    <1%
0    0%
21 06:58 9 614
32 50.168.74.196
1,846    <1%
0    0%
9 16:34 16 0
33 98.177.203.72
1,834    <1%
0    0%
6 01:00 0 3
34 73.15.72.81
1,785    <1%
0    0%
15 11:07 14 198
35 69.181.160.138
1,783    <1%
0    0%
7 15:25 5 66
36 209.114.114.191
1,723    <1%
0    0%
1 02:04 0 0
37 50.148.189.150
1,702    <1%
0    0%
1 17:59 1 52
38 67.169.167.68
1,674    <1%
0    0%
9 13:23 6 194
39 67.160.248.29
1,597    <1%
0    0%
16 09:13 14 172
40 73.202.29.237
1,595    <1%
0    0%
16 09:54 12 391
  Subtotals
157,557    33.2%
0    0%
4,471 2876:15:24 57,341 12,571
8,194 Others
317,603    66.8%
0    0%
32,869 1284:41:22 34,443 18,642
  Average
57    <1%
0    0%
4 06:41 11 3
8,234 Totals
475,160    100.0%
0    0%
37,340 4160:56:46 91,784 31,213
Go the Help Card.

Help Card: Visitors
Report Overview This report shows the IP addresses and/or hostnames of visitors to your site, along with their site usage statistics. Use this information to assess the usage of certain known site visitors, such as a prospective customer who has been interested in your organization. Every session undertaken and all pages viewed by each of the visitors in this report can be seen in the Visitors Click Stream report.

If only IP addresses (such as 192.77.210.55) are showing in the report, then you may need to enable DNS lookups, in Settings > Analysis > Network > DNS. Bear in mind that not all IP addresses on the Internet have a name associated with them.

Note: one visitor address or hostname may actually represent multiple visitors, and at times, hundreds or even thousands of visitors. This is due to the widespread usage of proxy servers, which store web sites to enable faster and cheaper access for those utilizing it. This problem can be overcome through the use of authenticating procedures (visitors logging in to the site with a username and password), or, in part, through the use of cookies.

Graph Description Vertical axis: Visitor.
IP address or hostname of the visitor being analyzed.

Horizontal axis: Hits (default sorting).
Hits to the site by the corresponding visitor. Changing the sorting options in Settings > Statistics will alter the horizontal axis to the new sort method. This report can be sorted/graphed by hits, bytes, sessions, pages and errors.

Red lines (if present):
HTTP errors (Page not found, server error, etc)

Table Description Visitor:
IP address or hostname of the visitor being analyzed.

Hits (%):
Number of hits to the site by the corresponding visitor. (Percentage as a proportion of hits to the site by all visitors.)

Bytes (%):
Bytes transferred as a result of hits by the corresponding visitor. (Percentage as a proportion of the bytes transferred as a result of hits by all visitors.)

Sessions:
Number of sessions undertaken by the corresponding visitor.

Mean time:
The average time spent on the website during each session undertaken by the corresponding visitor. It is represented in hours, minutes and seconds (HH:MM:SS).

Pages:
Number of pages viewed by the corresponding site visitor.

Errors:
Errors generated as a result of hits to the site by the corresponding visitor.
Go back to the top.

Copyright © Quest Software , 1997-2002