|
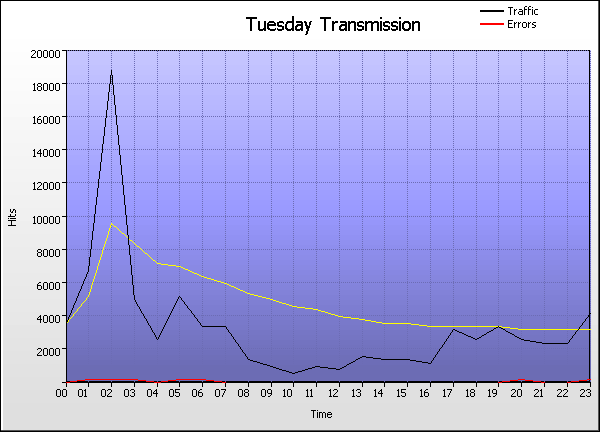
Tuesday Transmission |
| |
Time |
Hits |
% |
Bytes |
% |
Sessions |
Visitors |
Pages |
Errors |
|
1 |
00:00 - 00:59 |
|
|
283 |
249 |
561 |
121 |
|
2 |
01:00 - 01:59 |
|
|
297 |
249 |
531 |
320 |
|
3 |
02:00 - 02:59 |
|
|
316 |
269 |
695 |
376 |
|
4 |
03:00 - 03:59 |
|
|
325 |
264 |
552 |
276 |
|
5 |
04:00 - 04:59 |
|
|
268 |
225 |
430 |
136 |
|
6 |
05:00 - 05:59 |
|
|
297 |
252 |
499 |
278 |
|
7 |
06:00 - 06:59 |
|
|
294 |
245 |
486 |
253 |
|
8 |
07:00 - 07:59 |
|
|
238 |
206 |
687 |
167 |
|
9 |
08:00 - 08:59 |
|
|
224 |
189 |
437 |
83 |
|
10 |
09:00 - 09:59 |
|
|
199 |
176 |
481 |
123 |
|
11 |
10:00 - 10:59 |
|
|
159 |
138 |
340 |
50 |
|
12 |
11:00 - 11:59 |
|
|
182 |
159 |
437 |
98 |
|
13 |
12:00 - 12:59 |
|
|
191 |
161 |
349 |
47 |
|
14 |
13:00 - 13:59 |
|
|
198 |
165 |
440 |
80 |
|
15 |
14:00 - 14:59 |
|
|
174 |
150 |
641 |
126 |
|
16 |
15:00 - 15:59 |
|
|
212 |
184 |
592 |
97 |
|
17 |
16:00 - 16:59 |
|
|
201 |
168 |
436 |
110 |
|
18 |
17:00 - 17:59 |
|
|
249 |
212 |
575 |
129 |
|
19 |
18:00 - 18:59 |
|
|
229 |
203 |
499 |
170 |
|
20 |
19:00 - 19:59 |
|
|
273 |
242 |
466 |
189 |
|
21 |
20:00 - 20:59 |
|
|
241 |
206 |
571 |
202 |
|
22 |
21:00 - 21:59 |
|
|
249 |
217 |
534 |
191 |
|
23 |
22:00 - 22:59 |
|
|
227 |
194 |
509 |
107 |
|
24 |
23:00 - 23:59 |
|
|
264 |
226 |
625 |
202 |
| |
Average |
|
|
241 |
206 |
515 |
163 |
|
24 |
Totals |
|
|
37,340 |
8,234 |
12,373 |
3,931 |
|
|