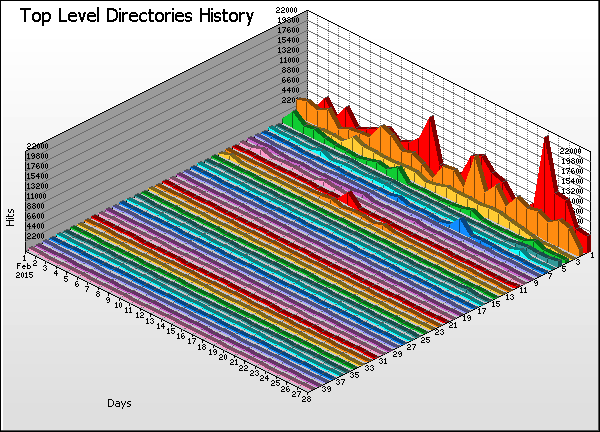
Directory Graph
Go the Help Card.


Top Level Directories History
  Directory Hits % Bytes % Pages Errors
1 /mspeck/
163,601    35.5%
0    0%
5,046 16,059
2 /jburrell/
123,543    26.8%
0    0%
123 24
3 /hit/
41,111    8.93%
0    0%
36,675 5,551
4 /library/
27,514    5.98%
0    0%
2,629 570
5 /mchan/
12,919    2.81%
0    0%
10,786 1,322
6 /jhui/
12,897    2.80%
0    0%
243 39
7 /rhulbert/
12,058    2.62%
0    0%
938 73
8 /hsun/
11,502    2.50%
0    0%
485 253
9 /jdelfrate/
11,252    2.44%
0    0%
2,948 167
10 /mgarrett/
10,413    2.26%
0    0%
4,783 150
11 /rrivas/
8,055    1.75%
0    0%
76 14
12 /statistics/
6,501    1.41%
0    0%
5,137 41
13 /jelliott/
2,169    <1%
0    0%
122 54
14 /dlamkin/
1,618    <1%
0    0%
124 24
15 /mthoppay/
1,613    <1%
0    0%
1,572 14
16 /curtis/
1,498    <1%
0    0%
1,254 117
17 /mmeyer/
1,411    <1%
0    0%
117 17
18 /jeffrey/
1,252    <1%
0    0%
1,032 201
19 /cbrockmeier/
498    <1%
0    0%
156 20
20 /math/
491    <1%
0    0%
317 64
21 /dguich/
479    <1%
0    0%
113 15
22 /cindy/
438    <1%
0    0%
325 51
23 /shuerta/
420    <1%
0    0%
103 21
24 /allcollege3/
339    <1%
0    0%
275 53
25 /plouraille/
316    <1%
0    0%
103 16
26 /embed/
296    <1%
0    0%
170 11
27 /smanske/
285    <1%
0    0%
96 20
28 /allcollege2/
268    <1%
0    0%
184 85
29 /phudak/
255    <1%
0    0%
236 12
30 /test/
230    <1%
0    0%
175 55
31 /jyu/
227    <1%
0    0%
126 22
32 /college_pres/
216    <1%
0    0%
197 21
33 /pgnehm/
187    <1%
0    0%
96 19
34 /ebell/
183    <1%
0    0%
98 21
35 /mkim/
158    <1%
0    0%
110 19
36 /wabdeljabbar/
147    <1%
0    0%
94 13
37 /dpiper/
144    <1%
0    0%
105 22
38 /hrandall/
141    <1%
0    0%
105 18
39 /flex_day/
138    <1%
0    0%
118 20
40 /nwylde/
135    <1%
0    0%
103 16
  Subtotals
456,918    99.2%
0    0%
77,495 25,304
123 Others
3,500    <1%
0    0%
2,954 1,078
  Average
2,824    <1%
0    0%
493 161
163 Totals
460,418    100%
0    0%
80,449 26,382
Go the Help Card.

Help Card: Top Level Directories History
Report Overview This report identifies the most popular top-level directories (folders) on your web server over time. Use this information to assess whether your most important content is consistently receiving its expected share of traffic. If certain directories are considered to be more important than others, then these should have more hits against them. If this is not the case, you may need to restructure your site. The information presented will be most meaningful if your site content is properly grouped into different directories (e.g. /support, /products, /contact, etc).

Graph Description Vertical axis: Hits (default sorting).
Changing the sorting options in Settings > Statistics will alter the vertical axis to the new sort method. This report can be sorted/graphed by hits

Horizontal axis: Days.
All days of the report period.

Depth (Z) axis: Top Level Directory.
The numbers along this axis correspond to the numbered entries in the table.

Table Description Directory:
Name of the directory being analyzed.

Hits (%):
The number of hits to files within the corresponding directory and its sub-directories. (Percentage of hits as a proportion of all hits to files within the corresponding directory and its sub-directories.)

Bytes (%):
Raw bytes transferred as a result of hits to files within the correpsonding directory and its sub-directories. (Percentage as a proportion of all bytes transferred for hits to files within the corresponding directory and its sub-directories.)

Pages:
Number of pages hit within the corresponding directory and its sub-directories.

Errors:
Number of server errors generated as a result of hits to files within the corresponding directory and its sub-directories.
Go back to the top.

Copyright © Quest Software , 1997-2002