|
Operating Systems History |
| |
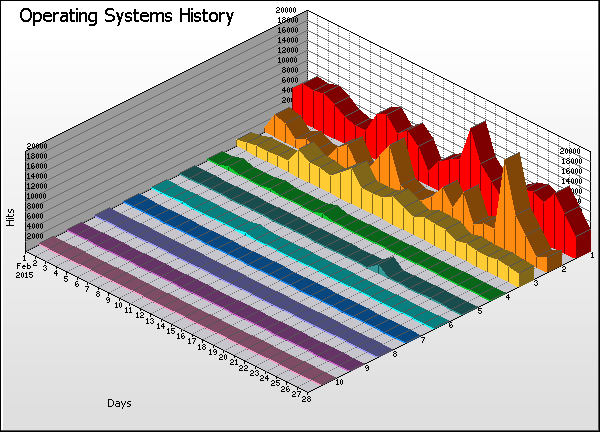
Operating System |
Hits |
% |
Bytes |
% |
Visitors |
Pages |
Errors |
|
1 |
Windows NT |
|
|
3,573 |
5,783 |
5,710 |
|
2 |
Mac OS |
|
|
3,312 |
2,918 |
10,120 |
|
3 |
Unknown |
|
|
2,337 |
71,833 |
13,455 |
|
4 |
Linux |
|
|
453 |
293 |
525 |
|
5 |
Windows XP |
|
|
541 |
1,354 |
262 |
|
6 |
Windows 95 |
|
|
85 |
193 |
99 |
|
7 |
Windows 2000 |
|
|
932 |
2 |
1 |
|
8 |
Windows 3.1 |
|
|
153 |
182 |
87 |
|
9 |
Windows 98 |
|
|
217 |
133 |
168 |
|
10 |
Windows Me |
|
|
67 |
0 |
1 |
| |
Average |
|
|
1,167 |
8,269 |
3,042 |
|
10 |
Totals |
|
|
11,670 |
82,691 |
30,428 |
|
|